We can get 8 units into Australia from Adafruit. If you order today, we can dispatch this stock between Jan 04, 2026 - Jan 07, 2026.
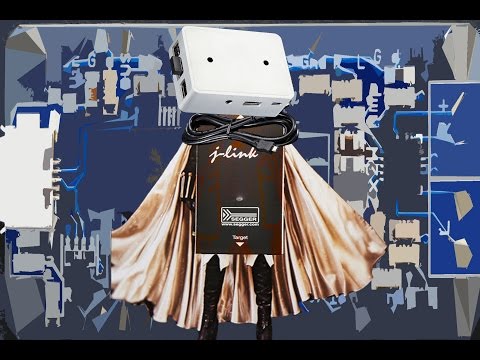
The SEGGER J-Link BASE is identical to the cheaper J-Link EDU model except for the terms of use.
If you're going to use your debugger strictly for personal, non-commercial projects, such as publishing open source designs that you're not selling, then you should get the EDU version! It's the same but significantly cheaper.
On the other hand if you're making money, or plan to make money off your project, then you're in the right place with the SEGGER J-Link BASE - JTAG/SWD Debugger. This is the best JTAG/SWD programmer/debugger, you will thank yourself for investing in this industry-standard tool!
Doing some serious development on any ARM-based platform, and tired of 'printf' plus an LED to debug?
A proper JTAG/SWD HW debugger can make debugging more of a pleasure and less of a pain. It allows you to program your devices at the click of a button, read or write memory addresses or registers on a live system, temporarily halt program execution at a given location or condition, and much more. Essentially, it's a direct window into what's going on inside your MCU at any given moment, giving you a level of access and control that's not easy to replicate with other debugging methods.
Of the dozens (and dozens!) of debuggers out there (we have literally drawers full of them!), we chose the J-Link for a number of reasons:
- It's USB based and uses a high-speed MCU internally, not an FTDI convertor like most low cost debugger. More debugging, less waiting!
- It support both JTAG (ARM7/9/11) and SWD (ARM Cortex), and has you covered for any core: ARM7/9/11, Cortex-A5/A8/A9, Cortex-M0/M0+/M1/M3/M4, Cortex-R4
- It's toolchain, IDE and vendor neutral, so you only need to buy one tool for all of your ARM needs and be done with it forever:
- Support GDB-based debugging and flash programming on Linux, Windows and the Mac via the free GDB Server
- Supports most major IDEs, including Keil, IAR Atmel Studio, Crossworks for ARM
- It includes flash-programming algorithms for most MCUs, and Segger is very pro-active about updating their drivers to support the newest chipsets.
- It just works, and keeps on working, and it'll be there for you in several years time.
The J-Link is fast. Stepping through breakpoints and reading memory addresses is quick, as is programming the flash memory on the chips. It's real strength, though, is that it's so vendor and tool neutral. Most chip vendors today provde low cost (or free) tools, but they also lock you into their chips and force you to accept the choice they've made for you. Segger's J-Link is a nice change in that respect, since you can be reasonably certain it will work with any chip, in any major toolchain, and you're free to change camp (or OS or IDE) without having to buy a new debugger every time.
Why Would I Want This?
You can do a lot of basic debugging with just printf and an LED, and you may not need a HW debugger to get started, but once you start to working on more complicated projects, you hit a debugging wall pretty quickly.
Your chip might be ending up in the HardFault handler, for example, but without a debugger it can be very hard to trace back exactly what is causing the problems. A debugger allows you to set 'breakpoints' in your code, where execution will temporarily stop, and you can check the value of memory or peripherals at that point in time, and then 'single-step' through your code line by line, executing your program until you find the place that causes your fault. There's a lot more to debugging than simple breakpoints, but you can often solve in a few minutes with breakpoints what would take much longer with printf and instrusive blocking mechanisms you insert into your code without a debugger.
Whether you're using GDB Server (GNU Tools) or an IDE and a commercial toolchain, it's also just a big convenience, since the J-Link can program the flash for you at the click of a button, reset the device, start execution, and then 'halt' on main(). You can do all these steps yourself -- programming the device via free tools over UART or via a USB bootloader, etc. -- but when you need to do that 40-50 times a day, it can get old quick, and 15 seconds saved make a huge difference when debugging. You can program a small MCU and break on main in 2-3 seconds with a J-Link, which makes the tools more or less invisible, which is a good thing when you have other problems to worry about.


